The lowest-scoring group had a 42.1% death rate during follow-up, compared with just 3.7% among those who scored highest. The difference was striking.
There’s a moment most people recognize. You stand up from the floor (after playing with a dog, picking something up, or sitting cross-legged at a picnic) and notice you need a hand. Or a knee. Or both. You tell yourself it was the angle, the surface, the shoes. What the research suggests is something less forgiving.
In a study tracking 4,282 adults, researchers asked participants to lower themselves to the floor and stand back up without using their hands, forearms, knees, or thighs for support. Over a median follow-up of 12.3 years, those who scored in the lowest group died at a rate of 42.1%. Those in the highest-scoring group: 3.7%. The gap is not subtle, and it held after adjusting for age, weight, and chronic disease.
That study, published in 2025 in the European Journal of Preventive Cardiology, is the most recent and longest-running evidence we have on lower-body function and mortality. It confirms something a growing body of research has been pointing toward for two decades: the strength and functional capacity of your legs carries information about how long you’ll live that most standard health markers (blood pressure, cholesterol, resting heart rate) simply don’t capture.
Why Leg Strength Shows Up in Mortality Data
The legs are, by mass, the largest muscle group in the body. The quadriceps alone account for roughly 40% of the muscle mass of the lower limb, and together the thigh muscles handle most of the mechanical load of walking, climbing, and rising from a seated position. When that capacity degrades, it shows up everywhere.
Anne B. Newman and colleagues at the University of Pittsburgh spent nearly five years tracking 2,292 adults between the ages of 70 and 79 in the Health, Aging and Body Composition (Health ABC) Study. They measured quadriceps strength directly using isokinetic dynamometry, a precise, equipment-based test that removes subjective effort from the equation.
What they found, published in the Journals of Gerontology in 2006, was that each standard-deviation decrease in quadriceps strength was associated with a 51% higher mortality risk in men and 65% higher in women. Muscle size told them almost nothing. Strength told them almost everything.
Muscle mass and muscle strength are closely related but not identical, and the Health ABC data drove a clean line between them: it’s functional capacity, not tissue volume, that predicts mortality. A larger muscle that has lost the ability to generate force rapidly doesn’t confer the protection that the same muscle at full capacity would.
The 12-Year Study and What It Actually Found
The most striking data in this field comes from the CLINIMEX Exercise cohort in Rio de Janeiro, led by Claudio Gil Araújo and colleagues. Their work uses a deceptively simple tool: the Sitting-Rising Test, or SRT.
No equipment required. No gym needed. You lower yourself to the floor from a standing position without using your hands, knees, forearms, or the side of your legs, then you stand back up the same way. Each support point you use costs you a point from a perfect score of 10.
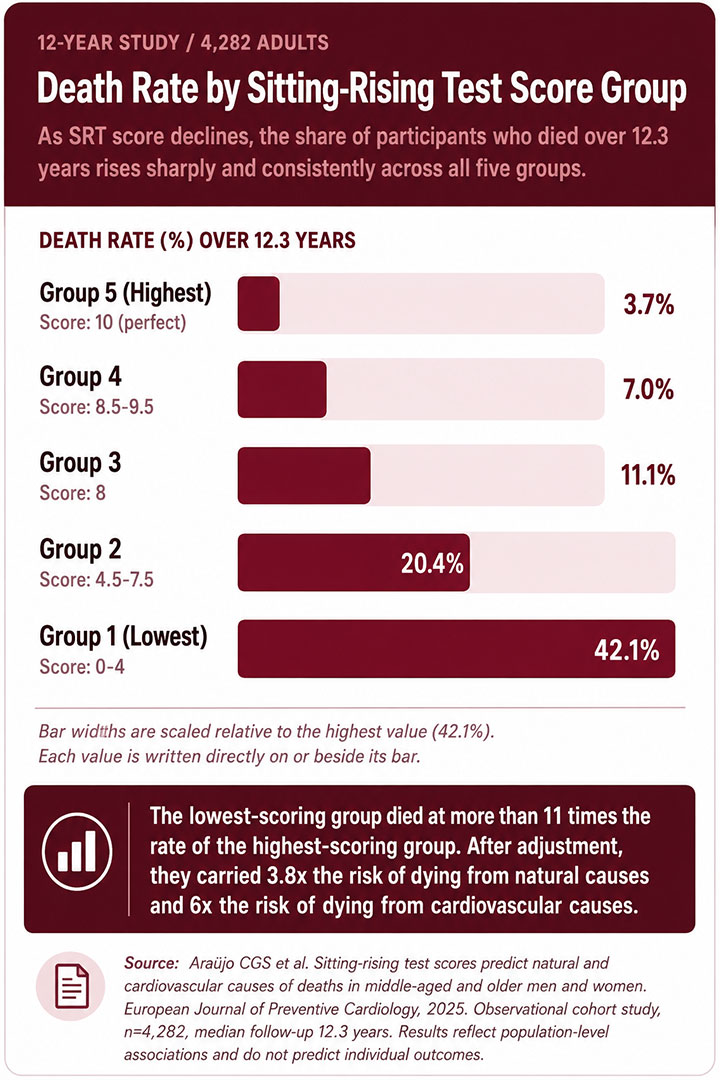
The 2025 follow-up study tracked 4,282 adults between the ages of 46 and 75 for a median of 12.3 years. Death rates climbed in a clear, stepped pattern across the five score groups: 3.7% in the top group, then 7.0%, then 11.1%, then 20.4%, and 42.1% at the bottom.
After adjusting for relevant covariates, those in the lowest group carried roughly 3.8 times the risk of dying from natural causes and 6 times the risk of dying from cardiovascular causes compared with those at the top. The relationship to cardiovascular mortality specifically is the new finding. No previous SRT study had separated that.
The SRT is measuring more than it appears. The test reflects lower-body and core strength (generating force to lower and rise), hip and ankle flexibility (to assume the seated position without assistance), balance (to manage the transitions cleanly), and body composition (as excess weight makes the movement mechanically harder).
It’s not a pure strength test. But strength is the hardest of those components to fake your way through, and researchers believe it drives much of the mortality signal.

The One-Legged Stance: Another Self-Test With Striking Results
Araújo’s group ran a companion analysis using a different equipment-free test. Participants stood unsupported on one leg for 10 seconds. It sounds easy. Among adults over 50, roughly one in five couldn’t do it.
The researchers followed 1,702 adults between the ages of 51 and 75 across a median of 7 years. Those who failed the one-legged stance test had a mortality rate of 17.5% over the follow-up period. Those who passed: 4.6%.
After adjustment, failure was associated with roughly twice the risk of all-cause death, according to a 2022 study in the British Journal of Sports Medicine. The test captures balance more than pure strength, but balance depends substantially on lower-limb function, and the mortality signal held even after accounting for chronic conditions.
Neither study claims the test is causing anything. What the data suggests is that these functional markers pick up a signal about physiological resilience that arrives well before a clinical diagnosis does. The body is telling you something; these tests are just a way of listening to it.
Leg Strength Longevity Self-Check
Three at-home assessments based on the tests used in mortality research. Takes about 3 minutes. No equipment needed.
Before you begin: Find a safe, clear space. Have someone nearby if you have balance concerns or a history of falls. These are educational screening tools, not medical tests.
What Does the Broader Evidence Say?
The CLINIMEX work is compelling, but two studies from one clinic in Rio de Janeiro is not a consensus. That’s where the broader literature comes in. A 2018 systematic review and meta-analysis led by Antonio García-Hermoso at the Universidad de Santiago de Chile pooled data from studies involving approximately 2 million adults and 63,087 deaths.
The review found that people with higher knee-extension strength, the primary lower-body strength measure, had a 14% lower risk of all-cause mortality (HR 0.86; 95% CI, 0.80-0.93), published in the Archives of Physical Medicine and Rehabilitation. That relationship held regardless of age and follow-up period. That’s about as close to a consensus finding as this field produces.
One clarification is worth making: leg strength is not the single strongest predictor of longevity. A 2025 analysis of the Copenhagen City Heart Study, following nearly 10,000 adults over 27 years, found that cardiorespiratory fitness carried a slightly stronger protective effect against both all-cause and cardiovascular mortality than muscular strength alone.
The two are additive, not competing. High cardiorespiratory fitness and high muscular strength together cut all-cause mortality risk in half compared with having neither, according to a 2018 UK Biobank analysis of 70,913 adults.
Cardiorespiratory fitness requires a timed walk test or a supervised bike test to measure precisely. Lower-body function you can assess right now, at home, in about 30 seconds, with no equipment and no clinician. That’s not a small distinction.
Why Strength and Size Are Not the Same Thing
The Health ABC Study finding that strength predicted mortality and muscle size did not, has been replicated across multiple cohorts and deserves more attention than it typically gets. Several mechanisms explain the gap.
Motor unit function is the least obvious of the three. As people age, the nervous system gradually loses the ability to recruit muscle fibers efficiently, even when the fibers themselves are present.
This is the part that trips people up: a muscle can look the same on a scan, same size, same tissue, and still generate considerably less force. What changed is the signal, not the structure. Strength tests capture this neuromuscular efficiency; imaging does not.
Falls are where the stakes matter the most. Strength predicts the ability to prevent them, and falls, particularly hip fractures in older adults, carry a mortality risk that most people underestimate.
Adults who take longer than 15 seconds to stand from a chair five times are nearly three times more likely to die earlier and 84% more likely to be hospitalized than those who complete the task faster, according to data from Confluent Health’s review of functional aging research.
Hip fracture carries a one-year mortality rate of 20-30% in adults over 65, a figure that compares unfavorably with several common cancers.
The metabolic angle is less obvious and probably underappreciated. Large lower-body muscles act as the body’s primary glucose processing site. When they weaken, insulin sensitivity decreases, and the downstream risk of type 2 diabetes, cardiovascular disease, and metabolic dysfunction increases. Muscle strength in the legs is, in this sense, a proxy for the health of a system far larger than the muscle itself.
What Starts to Change After 40, and When It Matters
Muscle strength typically peaks somewhere in the early-to-mid 30s. After that, it declines at roughly 1-2% per year, quietly, with no obvious symptom, at a rate that almost no one notices until the chair stand gets harder. After 60, that rate often triples. This is sarcopenia: the age-related loss of muscle mass and functional capacity that, left unaddressed, tracks directly toward the mortality signals above.
The practical implication is that the optimal time to build lower-body strength is before the steeper decline begins, not after. This is not an argument that strength training at 70 is too late. The evidence for meaningful strength gains in older adults is strong, and trained older adults lose strength more slowly than sedentary ones. The argument is that a 45-year-old who begins now starts from a higher baseline than the same person who waits until 65.
The other factor worth tracking is the speed of the decline, not just the level. People who are sedentary in their 40s and 50s tend to show a steeper drop in functional capacity as they age, and they reach the thresholds that predict poor outcomes: failing the chair stand, failing the one-legged stance, needing two hands to get off the floor. The SRT data shows the mortality signal starting to separate across groups in middle age, not just in the elderly.

How to Build and Keep Lower-Body Strength
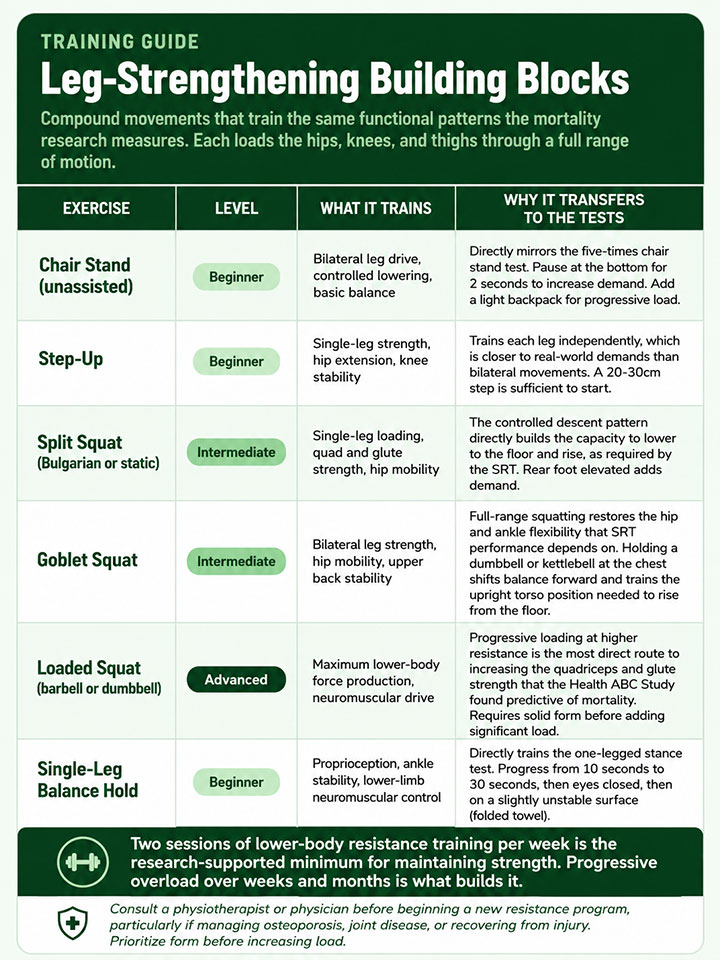
The evidence consistently points to compound, weight-bearing movements that load the hips, knees, and thighs through a full range of motion. The chair stand itself, lowering to a seat and rising without arm support, is both a useful training stimulus and the test.
Doing it repeatedly under control, adding pauses or a light backpack for load, is a legitimate resistance exercise for anyone starting from a lower baseline.
For people ready to add resistance, split squats, step-ups, and loaded squats are among the most transferable movements to real-world functional demands. They train the exact pattern: single-leg loading, controlled descent, strong push from the floor.
That’s the same pattern the mortality research measures. Leg press and knee extension machines are not substitutes. They remove the balance and stability requirements that account for much of the functional signal.
Two sessions of lower-body resistance training per week are the minimum that research supports for maintaining strength over time. Progressive overload, gradually increasing resistance, range of motion, or volume over weeks and months, is what turns a maintenance program into one that actually builds capacity.
Testing Yourself: What the Numbers Mean
The three tests in the research each measure something slightly different, and they’re most useful when read together rather than passed or failed in isolation.
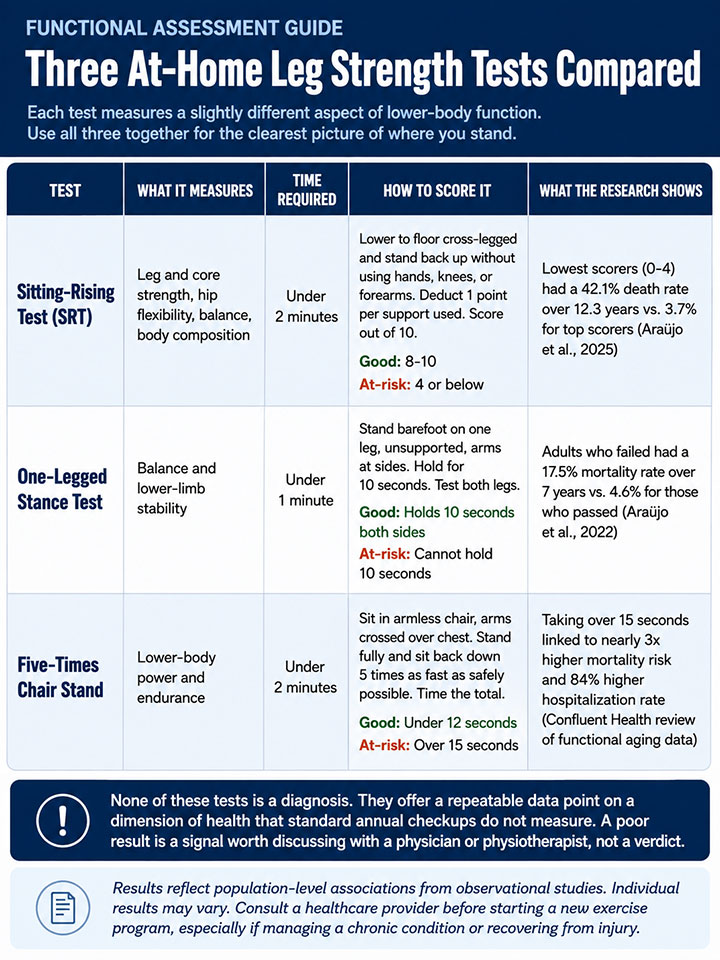
The Sitting-Rising Test (SRT) is the most comprehensive. From standing, lower yourself to a cross-legged seated position on the floor and return to standing, using only your legs and core. Each time you place a hand, forearm, or knee on the floor, or visibly wobble through the transition, subtract a point from five. Add your sitting and rising scores together for a total out of 10. The mortality data shows meaningful separation starting around a score of 8; the highest-risk group scored 4 or below.
The one-legged stance test is simpler: stand barefoot on one leg, unsupported, and hold it for 10 seconds. Do both sides. Failure on either leg in adults under 65 is worth paying attention to.
The five-times chair stand tests speed and endurance. Sit in an armless chair with arms crossed over your chest, then stand fully and sit back down five consecutive times, as fast as you can safely manage. Adults completing it in under 12 seconds are in good functional range; taking longer than 15 seconds places you in the risk group described in the institutional data above.
None of these tests is a diagnosis. What they offer is a concrete, repeatable data point on a dimension of health that standard annual checkups don’t measure, and that the mortality data says matters.
A Note on What This Research Can and Cannot Tell You
Every study above is observational. Lower-body strength and function predict mortality outcomes with striking consistency across multiple large cohorts, but correlation is not a mechanism, and none of these studies can prove that building leg strength will extend your life by a specific number of years.
Researchers still don’t have high-quality randomized trial data confirming that improving SRT scores, for example, causes the mortality risk to drop proportionally.
What the research can tell you is that the signal is real, it shows up in data from multiple countries and populations, it persists after adjusting for the obvious confounders, and it reflects something about physiological capacity that standard clinical markers miss. That’s a meaningful body of evidence, used appropriately.
If you are managing a cardiovascular condition, recovering from injury, or have been diagnosed with osteoporosis or joint disease, speak with a physiotherapist or physician before beginning a new lower-body resistance program. The exercises that build the most functional strength are also the ones that carry the highest injury risk when form breaks down.
The Bigger Picture
What the CLINIMEX data shows, most clearly in the 12.3-year follow-up published in 2025, is that the body accumulates a kind of physical reserve across decades, and that reserve can be measured with a test that takes 30 seconds and requires nothing but a floor.
The 42.1% death rate in the lowest-scoring group is not a prediction about any individual. It is a population-level signal about what happens when that reserve is depleted.
The research doesn’t promise that strong legs will make you live longer. It suggests that the capacity to lower yourself to the floor and get back up, without help, without ceremony, tells you something real about where you are.