Unlike studies comparing different age groups, researchers followed the same people for 47 years. What they saw changed the picture of aging.
You probably picture age-related muscle loss as something that announces itself in unmistakable ways: stairs that now require a second thought, bags that suddenly feel heavier, the kind of physical change that belongs to people who are, as you privately think of it, older than you are. Most people do. The picture is wrong.
A 47-year Swedish study published in the Journal of Cachexia, Sarcopenia and Muscle tracked 427 ordinary men and women from age 16 to age 63. The researchers measured aerobic capacity, muscular endurance, and muscle power at five points across those decades.
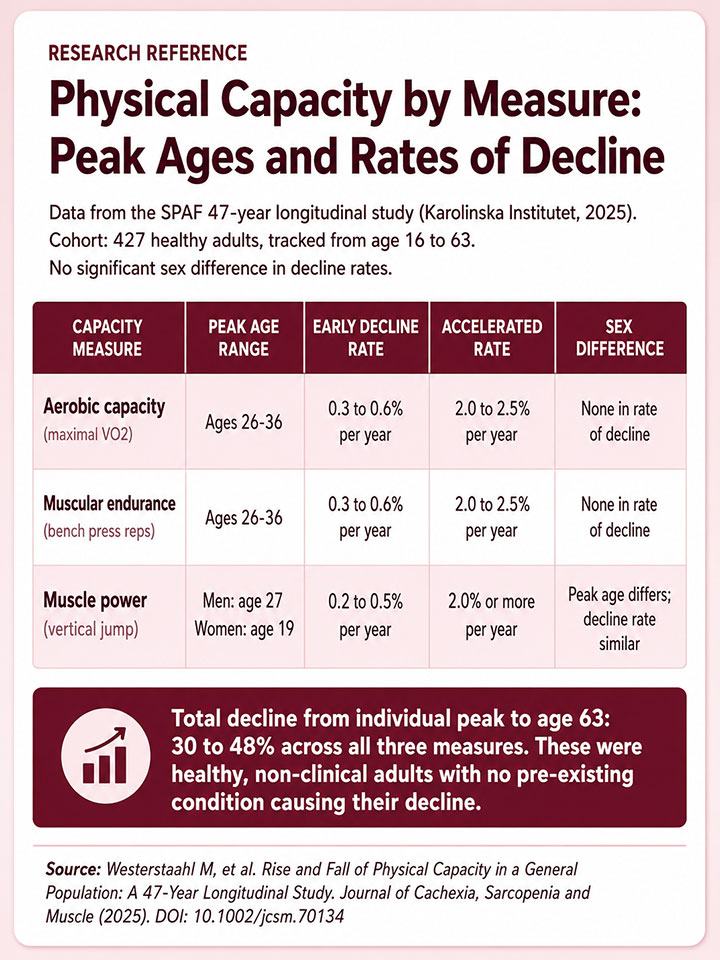
Physical performance peaked between ages 26 and 36, then began a measurable decline around age 35. These were healthy, non-clinical adults with varying levels of activity. The decline happened regardless of how much they had trained.

The Age Nobody Is Talking About
Most of what people know about muscle loss comes from cross-sectional research: scientists comparing one group of 30-year-olds with a different group of 60-year-olds and inferring what happens in between. The logic is reasonable. The picture it produces is blurry.
Maria Westerståhl, a lecturer at Karolinska Institutet’s Department of Laboratory Medicine and the lead author of the Swedish Physical Activity and Fitness study (SPAF), took a different approach. Her team followed the same randomly selected group of Swedish men and women, testing them at five points across 47 years.
Not different people at different ages. The same people, getting older. The cohort is still being tracked. The same participants will be tested again at age 68, which makes this one of the few muscle-aging datasets that is genuinely longitudinal rather than inferred. What that design revealed was sharper than earlier estimates had suggested.
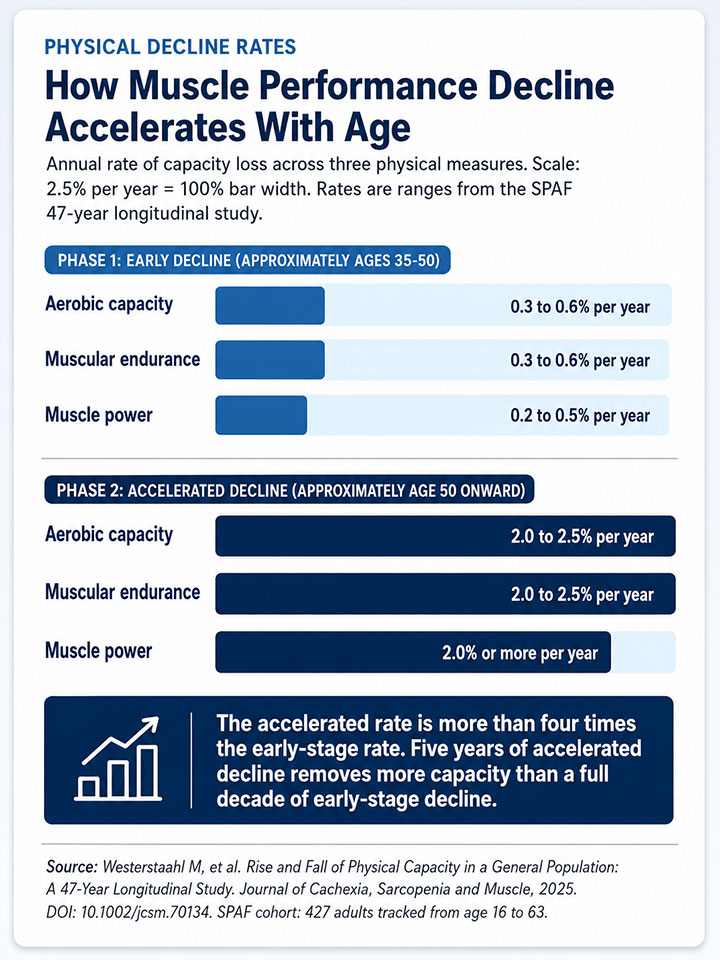
Maximal aerobic capacity and muscular endurance, measured by bench-press repetitions, peaked between ages 26 and 36 in both men and women. After that, decline started at roughly 0.3 to 0.6 percent per year.
Over time, that rate accelerated to between 2.0 and 2.5 percent per year. Muscle power, tested via vertical jump, peaked slightly earlier: at 27 for men and 19 for women. By age 63, the participants had lost between 30 and 48 percent of their peak physical capacity.
For anyone asking what age muscle loss starts, the SPAF data offers a more specific answer than the standard medical advice provides. Functional decline is measurable around 35 in healthy adults, across every capacity the researchers tracked.
Muscle Mass and Muscle Performance Are Not the Same Thing
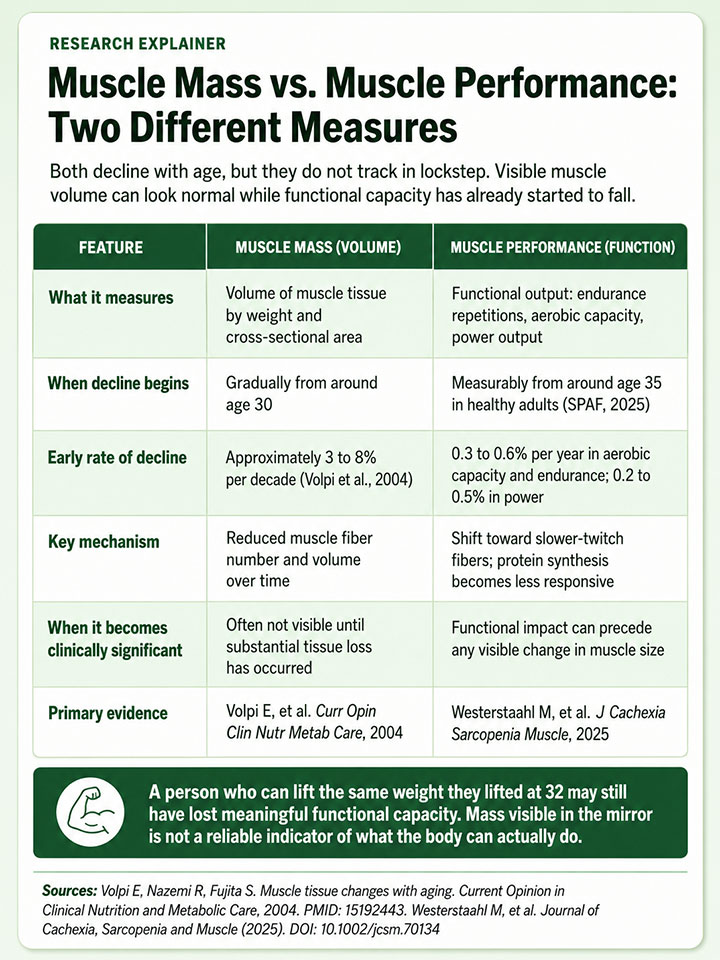
The figure most people have heard is this: muscle mass decreases roughly 3 to 8 percent per decade starting around age 30, with the rate increasing further after 60. That estimate comes from a foundational 2004 review in Current Opinion in Clinical Nutrition and Metabolic Care by Elena Volpi, MD, PhD, and colleagues at the University of Southern California. It has been the reference point for nearly every muscle-loss article published since. It describes what is measurably lost in muscle tissue by weight and volume.
The SPAF study measured something adjacent but distinct: functional capacity, meaning how far a bench press can go, how high someone can jump, how much aerobic work the body can sustain. These performance markers can begin declining while a person still has the muscle mass of someone a decade younger.
The relationship between mass and performance is real, but they do not track in lockstep. Muscle fiber composition shifts toward slower-twitch fibers before mass loss becomes clinically significant. Protein synthesis becomes less responsive to the same stimuli it once responded to efficiently. Mitochondrial activity in skeletal muscle declines.
The practical implication is that a person who can lift the same bags they lifted at 32 may still have lost meaningful functional capacity in the kinds of movements that only get tested when something goes wrong. Mass visible in the mirror can mask changes that are happening well underneath it.
The Rate Is the Real Story
The early annual decline, 0.3 to 0.6 percent per year, is genuinely easy to dismiss. Spread across a decade, it removes roughly 3 to 6 percent of peak capacity. For most people in their late 30s and early 40s, that translates to nothing they would notice day-to-day. The natural response is to conclude that the whole thing is not yet relevant.
The acceleration changes that conclusion. The SPAF cohort’s decline rate eventually reached 2.0 to 2.5 percent per year, a rate more than four times the early-stage figure. A single year at that pace is still subtle. Five years compounded is not. By the 60s, the rate of loss outpaces what most people’s activity levels can meaningfully counter.
The 30 to 48 percent total loss by age 63 lands with different weight once you factor in that these were healthy, non-clinical adults with no particular medical reason to expect that level of decline. Age 63 is not old by any current definition of the word. The pattern of decline, once established, does not correct itself without intervention.
What that abstract rate looks like in practice is a different question.
Signs of Losing Muscle Mass
Clinical sarcopenia has formal diagnostic criteria, most of which require a specialist and a DEXA scan to confirm. The functional changes that precede that stage are easier to notice. Carrying the same load over a longer distance, grocery bags on a walk from the car, a backpack across a campus, requires more effort than it did a decade ago.
Recovery from physical exertion takes longer. Balance on uneven ground, a hiking trail, a crowded sidewalk, feels less instinctive than it once did.
None of these are diagnostic on their own. They are data points. What the SPAF data adds is less precise than a clinical checklist: these experiences, if they appear in someone’s early 40s, are not ahead of schedule. They are the schedule.
What Actually Slows It Down
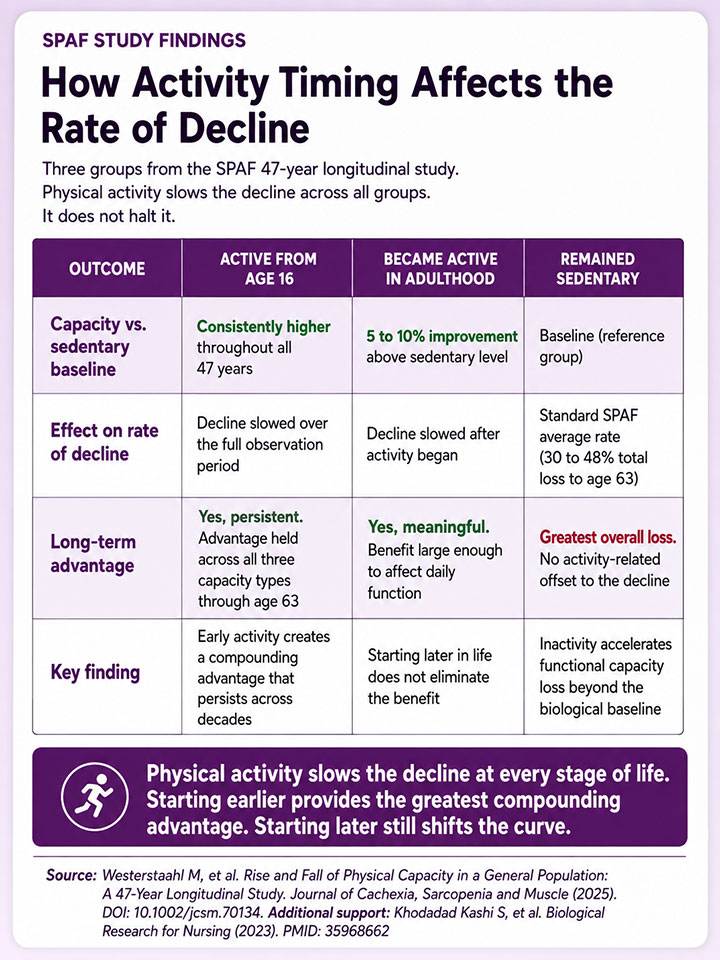
The activity findings from SPAF are encouraging. Worth saying plainly upfront, though: this is not a reversal story. Physical activity slows the decline without halting it. That framing matters for how you read what follows.
With that established, Westerståhl’s words were clear. “It is never too late to start moving,” she said. “Our study shows that physical activity can slow the decline in performance, even if it cannot completely stop it.” Participants who had been physically active from age 16 maintained meaningfully higher aerobic capacity, muscular endurance, and muscle power across the entire 47-year observation period. That early advantage was real and persistent.
Adults who became physically active later in adulthood still improved their physical capacity by 5 to 10 percent compared to those who remained sedentary. A benefit large enough to matter in daily function. Starting later in life does not eliminate it.
A 2023 systematic review and meta-analysis in Biological Research for Nursing by Sholeh Khodadad Kashi and colleagues at K.N. Toosi University of Technology reviewed randomized controlled trials in adults aged 60 and older and confirmed that resistance training produces measurable improvements in muscle strength and functional exercise capacity.
The RCTs were conducted in older adults, so extrapolating directly to someone in their 30s or 40s requires caution. The direction of benefit is consistent across the age groups studied.
Muscle Loss After 40: Is It Too Late?
The short answer is no, and the question itself contains a small misdirection. “Too late” implies that the relevant window has closed, that the biology is finished and intervention is pointless. The SPAF data does not support that reading.
Starting resistance training at 40 puts a person roughly five years past the earliest measurable decline and probably a decade before the rate begins its steeper acceleration. That window is meaningful.
The most supported combination in the research is resistance training two to three times per week paired with adequate protein intake. The 2004 Volpi review notes that older adults may need approximately 1 gram of protein per kilogram of body weight daily, higher than the standard recommended dietary allowance of 0.8 grams per kilogram.
Amino acids are the direct stimulus for muscle protein synthesis, and the response diminishes if intake falls short. Protein timing and training consistency matter more than either factor alone.
The goal is to push the point at which physical capacity begins affecting daily life further into the future. That is achievable in people’s 40s, their 50s, and, as the RCT evidence confirms, their 60s and beyond.
There is one detail about the SPAF study that has not come up yet: it is not finished. The same cohort will be tested again at age 68, and the researchers plan to link physical capacity changes to biological markers and long-term health outcomes. A 47-year study is, apparently, a work in progress.
That commitment does not change what the existing data has already made plain. Decline happens, in healthy adults, on a schedule that has nothing to do with how they feel. What matters is what a person does with the 10 or 15 years between when the process starts and when it becomes something they notice. The evidence on that, for once, is reasonably clear.