BMI has been medicine’s default weight metric for seven decades. It appears on lab reports before blood pressure, shapes eligibility for clinical trials, and gets referenced at almost every annual physical.
But when researchers at the 2026 European Congress on Obesity compared standard BMI readings against clinical body fat scans in over 1,300 adults, more than one in three turned out to have been placed in the wrong weight category. The calculation is not in dispute. Knowing what the result actually means for your age, your background, and your specific body is the harder question.
How BMI Is Calculated
BMI divides body weight in kilograms by height in meters squared: BMI = weight (kg) / height (m)². A person weighing 70 kg at 1.75 m has a BMI of 70 / (1.75 × 1.75) = 22.9. In imperial units: BMI = × 703. At 154 lbs and 5 feet 9 inches, that gives (154 / 4,761) × 703 = 22.7.
The formula traces to a 1972 analysis by Ancel Keys and colleagues comparing weight-for-height indices across 7,400 men in 12 countries. Keys’ team found that the ratio of weight to height squared outperformed other relative weight measures at predicting body fatness. The name Body Mass Index stuck. All of the original measurements were collected from men, a detail that would prove significant as the formula spread to women and populations beyond Western Europe.
BMI Calculator for Women and Men
Enter your measurements below. The calculator accepts both metric and imperial units. Age and sex inputs are optional, but adding them enables age-adjusted interpretation for adults 65 and older, along with sex-specific context about body fat.
BMI Calculator for Women and Men
Includes age-adjusted interpretation and optional waist-to-height ratio check
This calculator is for informational purposes only. Consult a healthcare professional for personal medical advice.
BMI Categories
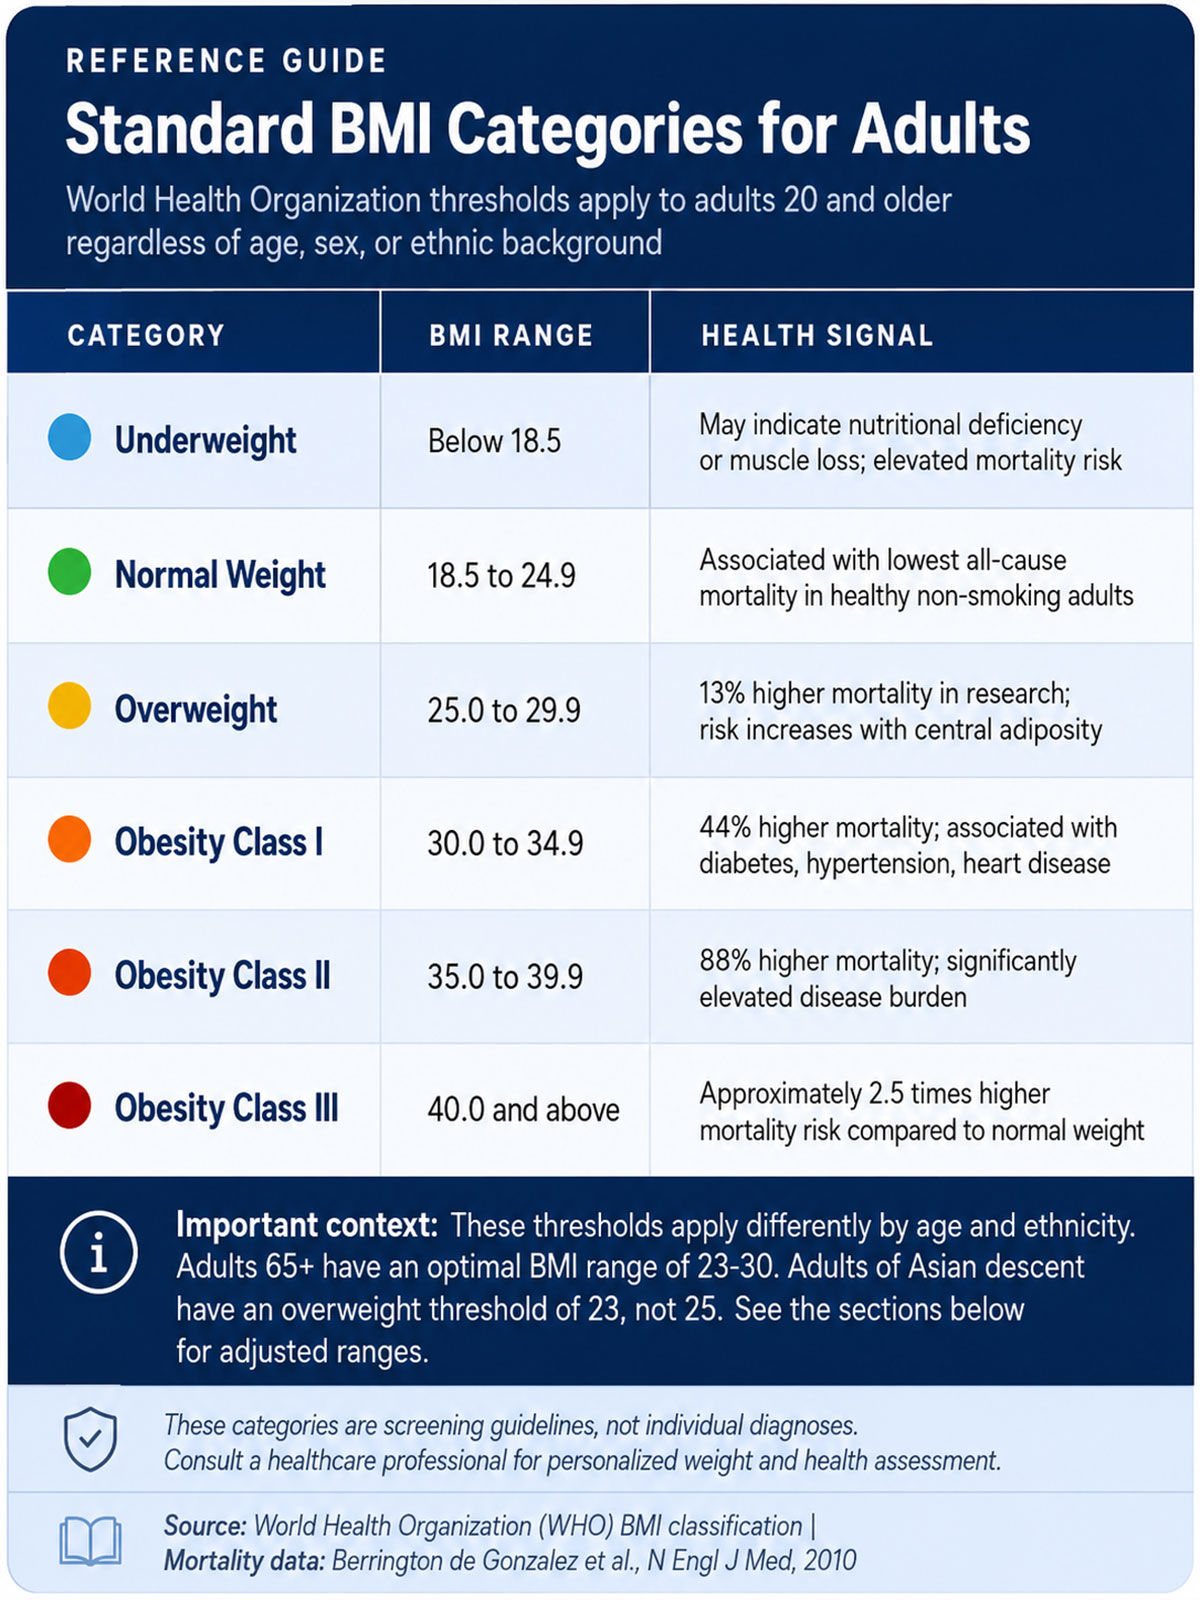
The World Health Organization defines four standard BMI categories for adults. These thresholds apply the same way to all adults regardless of age, sex, or ethnic background. That blanket approach is one of the tool’s documented limitations.
For sedentary adults without unusual muscle mass, a BMI in the normal weight range remains one of the more practical screening indicators available. The problems arise when a result sits near a category boundary or when the person being assessed does not fit the population on which the original thresholds were built.
What Your BMI Result Means
A BMI number places you in a category. What that category means for your health depends on factors the formula cannot see: how much of your body weight is fat versus muscle, where that fat is concentrated, and how your ethnic background affects metabolic risk at different weight levels.
One measure of how well BMI identifies excess fat comes from a large study of 13,601 adults reviewed in StatPearls’ clinical reference for Body Mass Index. Among women in that dataset, BMI-defined obesity was present in 31%, but when body fat was measured directly, the figure was 62%. BMI correctly identified obesity when it was present (high specificity) but missed roughly half the women who actually had it (poor sensitivity). A BMI in the healthy range does not guarantee a healthy body fat percentage.
BMI for Women and Men
The formula is identical for both sexes. The interpretation is not. At the same BMI, women typically carry a higher percentage of body fat than men, because women have more essential fat stored for hormonal function and reproduction. Standard BMI categories were not recalibrated for this biological difference when the metric was extended from men to women after Keys’ original research.
The practical effect appears most clearly at category boundaries. A woman with a BMI of 24.5 who falls in the healthy range may be carrying a body fat percentage that, if measured directly, would indicate elevated metabolic risk. The opposite pattern applies to men with substantial muscle mass. A male athlete or manual laborer can record a BMI of 26 or 27, technically overweight, while carrying very little excess fat. The formula cannot distinguish lean mass from fat mass. For women, who carry proportionally more essential fat than men by design, this has meant 70 years of a metric calibrated on male bodies and applied without adjustment.
BMI After 65: The Numbers Shift
Standard BMI was built on data from working-age adults. For older adults, the thresholds mean something different, and treating them as benchmarks after 65 can be actively misleading.
A 2022 meta-analysis by Kıskaç and colleagues published in the Annals of Geriatric Medicine and Research examined BMI and all-cause mortality in older adults and found that the optimal BMI range for longevity sits at approximately 23 to 30 for adults 65 and older, considerably higher than the standard healthy range of 18.5 to 24.9. Their data pointed to optimal values near 31 to 32 for older women and 27 to 28 for older men.
The mechanism is sarcopenia, the age-related decline in skeletal muscle mass that begins in the 30s and accelerates after 60. By the time a person reaches their 70s, they may have less than half the muscle mass they carried at 25. The implication is counterintuitive: a slightly higher BMI in old age often reflects the muscle reserves needed to recover from illness, surgery, or infection. Colleen Christmas, a geriatrician at Johns Hopkins’ Division of Geriatric Medicine, has noted that roughly 60% of older adults would fall in the overweight or obese category under standard thresholds, but that this does not mean they need to lose weight.
For older women specifically, a BMI between 25 and 29.9 (classified as overweight by standard thresholds) has been associated with better bone density and reduced fracture risk after 60. Being slightly above the standard healthy range may be protective in ways the standard chart does not capture.
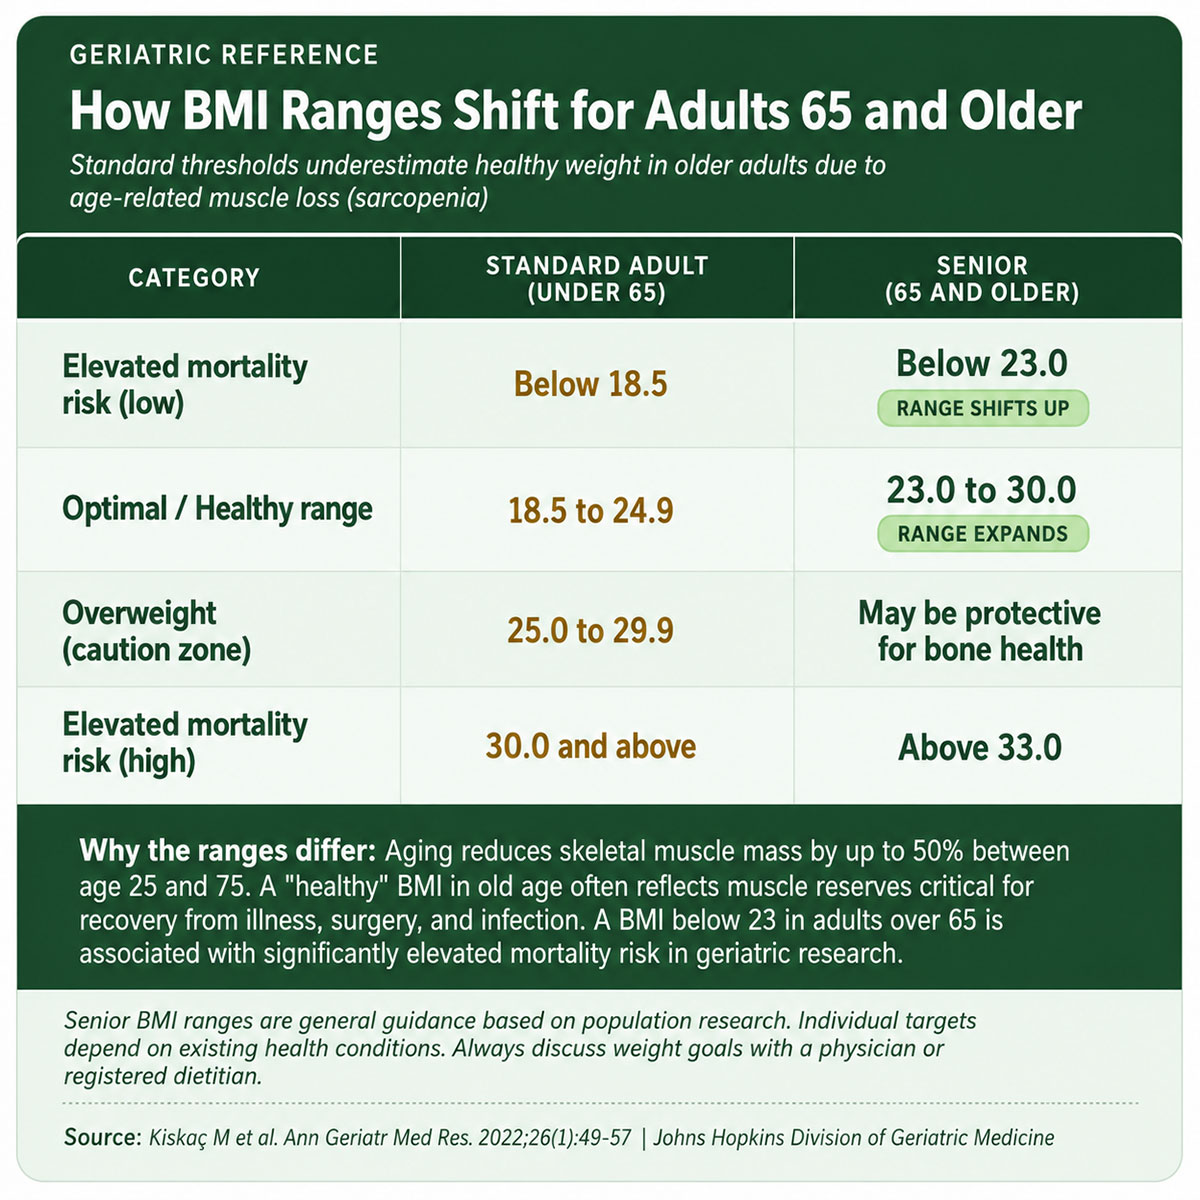
Optimal ranges for older adults are general guidance based on population-level research, not individual targets. Always discuss specific weight goals with your doctor, as existing health conditions affect the appropriate range for any individual.
BMI and Ethnicity
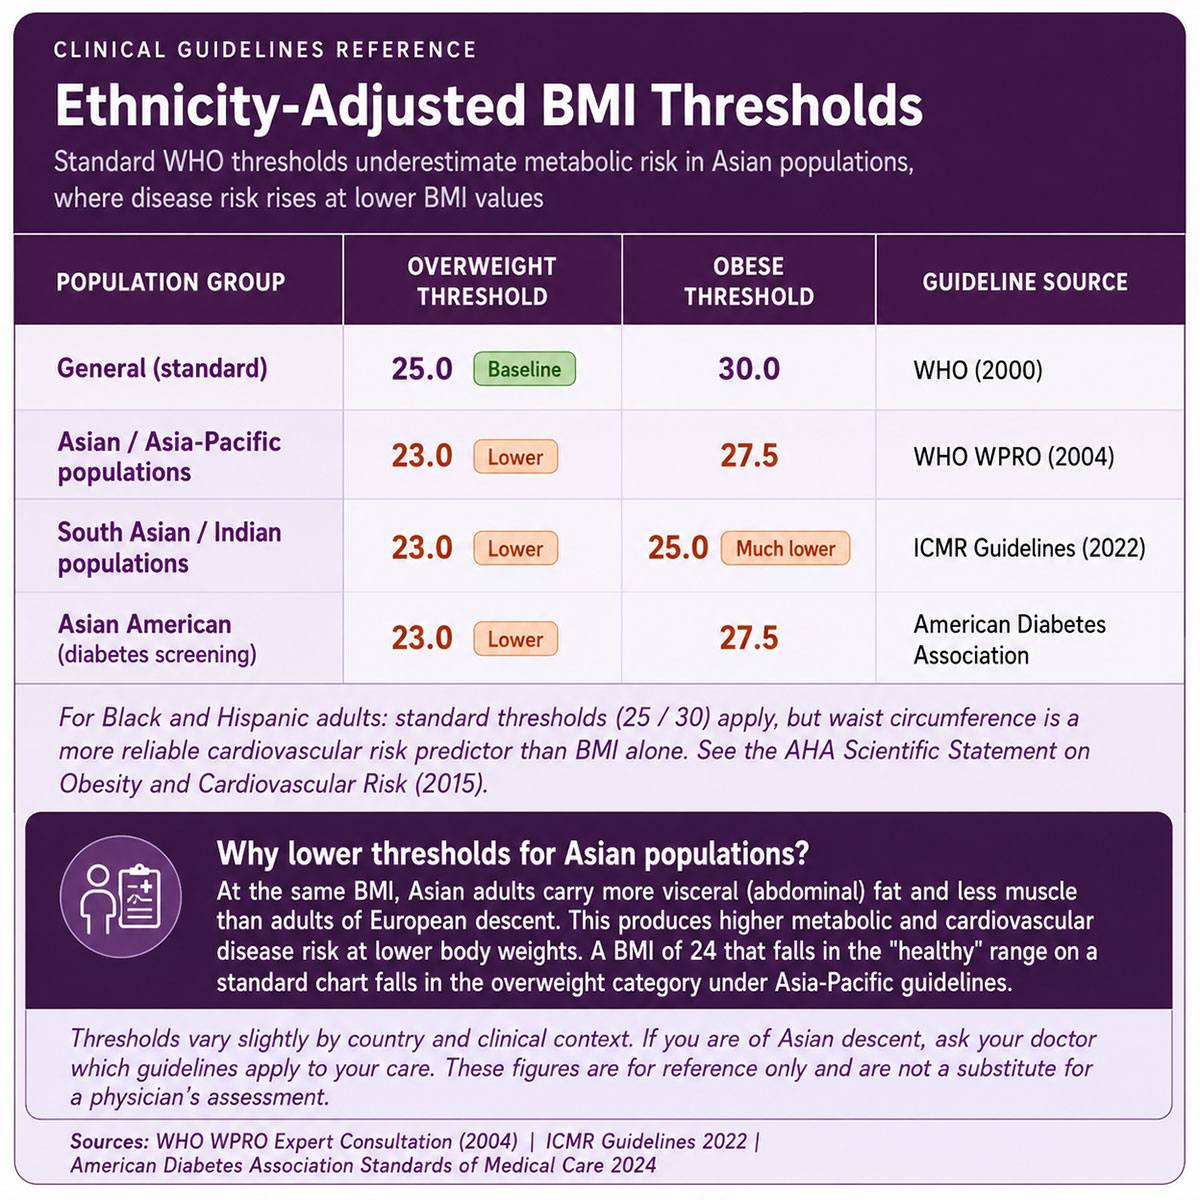
Standard WHO BMI thresholds were developed using data drawn predominantly from European and North American populations. Applied to Asian adults, they consistently underestimate metabolic risk.
In 2000, the WHO convened a separate expert consultation to establish BMI classifications for Asian populations. That a separate standard was necessary (decades after BMI had become the global default) says something about whose bodies the original thresholds were built to describe. The consultation drew on evidence from Japan, China, Taiwan, Singapore, India, Indonesia, the Philippines, and Thailand. The data across all those countries pointed in the same direction: metabolic disease risk increases at lower BMI values in Asian adults than in adults of European descent. The Asia-Pacific classification that followed sets overweight at BMI 23, not 25, and obese at 27.5, not 30. India’s ICMR 2022 guidelines set the obesity threshold lower still, at BMI 25.
The American Diabetes Association notes that Asian American adults show substantially higher diabetes risk at any given BMI compared to non-Hispanic white adults, and recommends lower BMI screening thresholds for this population. Exactly how these adjusted cutoffs apply to people of mixed heritage remains an open question in the research. The data exists for distinct ethnic populations and has not been fully worked out for those in between.
If you are of Asian descent, your doctor may apply these adjusted thresholds when assessing weight-related risk. A BMI of 24 falls in the standard healthy range and, under Asia-Pacific guidelines, in the overweight category. That is a clinically meaningful difference.
A More Complete Check: The Waist-to-Height Ratio
BMI tells you how much you weigh relative to your height. What it cannot measure is where that weight is located. Two people with identical BMIs can have very different cardiovascular risk depending on whether their excess weight is distributed across their frame or concentrated at the waist in the form of visceral fat.
Waist-to-height ratio (WHtR) addresses this gap directly. A UPMC and University of Pittsburgh study published in October 2025 followed 2,721 adults for more than five years and found that WHtR was the only anthropometric measurement to consistently predict future cardiovascular disease after other risk factors were controlled for. BMI and waist circumference both lost predictive power in the full model. WHtR held, and the effect was strongest in people with BMIs below 30 who might otherwise appear to be at low risk.
The calculation is simple: divide waist circumference by height, using the same unit for both measurements. A result above 0.5 (meaning your waist is wider than half your height) is associated with elevated cardiometabolic risk regardless of what your BMI says. A meta-analysis of more than 512,000 participants had reached the same broad conclusion: WHtR outperformed BMI for predicting diabetes, metabolic syndrome, and cardiovascular mortality. What the UPMC study added was more specific: that finding held most powerfully in people with BMIs below 30, who would otherwise have no flag for cardiovascular risk at all. That narrows who needs this check most. WHtR does not replace BMI. The two measurements cover different aspects of the risk picture.
The BMI calculator on this page includes an optional WHtR check. Add your waist measurement to get both readings at once.
BMI for Kids and Teens
For children and adolescents between 2 and 19 years, BMI is calculated using the same formula as for adults. The interpretation works differently. Because children’s body composition changes with age and girls and boys develop on different timelines, the same BMI number carries a different health signal at 8 than it does at 15.
Pediatric BMI is assessed using age- and sex-specific growth charts produced by the CDC, where the relevant output is a BMI percentile relative to other children of the same age and sex. A result at the 70th percentile for a 10-year-old is not the same signal as the 70th percentile for a 16-year-old. The CDC growth chart tools for children and teens, available at cdc.gov, should be used in place of adult calculators for anyone under 20.
BMI Chart
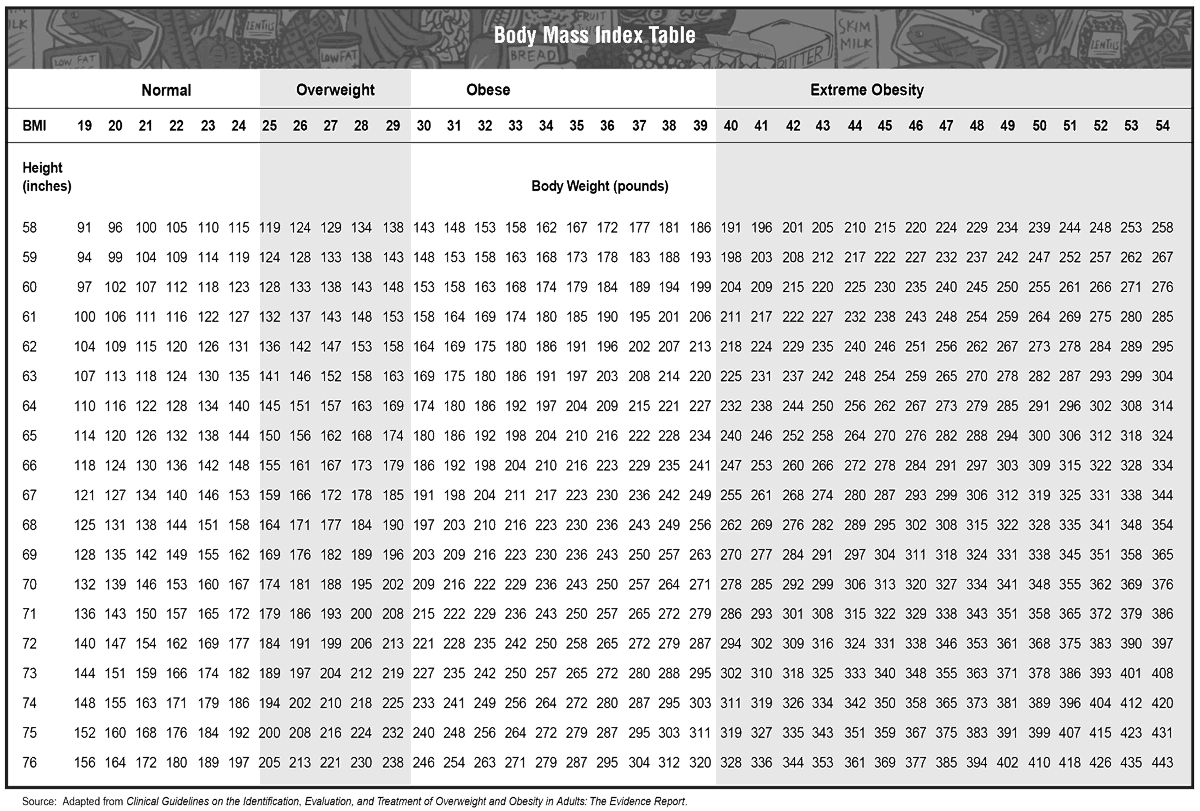
Body mass index can also be read from the reference chart below. Find your height on the left-hand side and follow that row across to your body weight. Your BMI appears at the top of the corresponding column. For adjusted ranges that apply to adults 65 and older or adults of Asian descent, see the relevant sections above.
BMI and Risk of Death
The largest mortality dataset on BMI pooled results from 19 long-term prospective studies tracking 1.46 million adults (more than half of them women) for a median of 10 years. Amy Berrington de Gonzalez at the National Cancer Institute coordinated that work, and the pooled analysis was published in the New England Journal of Medicine in 2010. By restricting the analysis to healthy adults who had never smoked, the researchers separated the effect of body weight from the confounding influence of tobacco and pre-existing illness on mortality.
The results showed a clear dose-response relationship, with the lowest mortality concentrated in a BMI range of 22.5 to 24.9. Compared to that reference group, the risk escalated at each category step. Overweight women (BMI 25 to 29.9) had 13% higher all-cause mortality. Class I obesity (BMI 30 to 34.9) carried 44% higher risk. Class II obesity (BMI 35 to 39.9) carried 88% higher risk. At the most severe category, BMI 40 to 49.9, mortality was approximately 2.5 times higher than in the reference group, a 151% increase. Outcomes were broadly similar for men across each of these steps. For every five-unit rise in BMI, all-cause mortality increased by approximately 31%.
Two things qualify those figures. First, the study examined white adults only. Its mortality data cannot be assumed to apply uniformly across ethnic groups, which is one reason the adjusted thresholds for Asian populations carry clinical weight rather than just being a policy footnote. Second, the mortality curve was J-shaped, not linear. Very low BMI also carried an elevated risk in this dataset. Underweight was not a neutral outcome.
A 151% higher mortality risk needs to be understood on a human scale. At a BMI of 40, a 5-foot-9 person weighs approximately 270 lbs. The research is not making an aesthetic judgment. It is reporting that, across 1.46 million tracked adults, the probability of dying during the follow-up period was two and a half times higher in that weight category than in the healthy range.
Frequently Asked Questions
How do I calculate my BMI?
Divide your weight in kilograms by your height in meters squared (BMI = kg/m²). In imperial measurements, divide your weight in pounds by your height in inches squared, then multiply by 703. The calculator above handles both methods automatically.
Is 140 lbs overweight for a 5’4″ woman?
At 5 feet 4 inches and 140 lbs, the BMI works out to (140 / 4,096) × 703 = 24.0, which falls in the standard WHO healthy range of 18.5 to 24.9. Under the WHO Asia-Pacific guidelines for adults of Asian descent, that same reading falls in the overweight category, since the overweight threshold is 23 rather than 25. For women over 65, the senior-adjusted optimal range of 23 to 30 applies. The number is the same. What it means depends on who is reading it.
What is a healthy BMI for my height and age?
For adults under 65, the standard WHO healthy range is 18.5 to 24.9, regardless of height, since BMI is already a height-adjusted measurement. Adults 65 and older have a shifted optimal range of approximately 23 to 30, based on geriatric research showing that lower BMI in older adults is associated with muscle loss and increased mortality. For adults of Asian descent, the healthy range ends at 22.9 rather than 24.9 under WHO Asia-Pacific guidelines.
What is a healthy BMI for seniors?
For adults 65 and older, a BMI between 23 and 30 is currently supported by geriatric research as the optimal range for all-cause mortality outcomes. A BMI below 23 in older adults is associated with sarcopenia and elevated mortality risk. A BMI between 25 and 29.9 (classified as overweight by standard thresholds) has been linked to better bone density and improved recovery from illness in women over 60. Individual health conditions significantly affect the right target for any particular older adult, so always discuss specific BMI goals with a physician.
BMI is a practical first approximation that took decades of research and millions of participants to validate. For most sedentary adults, the number is still worth knowing. What it cannot do, on its own, is tell you whether your weight represents a health problem for your particular body. Age shifts the optimal range. Ethnic background shifts the thresholds. Where weight is located in the body changes the cardiovascular risk picture entirely. The calculator above takes 30 seconds. The context around it is what makes the number worth having.